The Client You Think Is Your Best — Might Be Your Least Profitable
Revenue doesn't equal profit. Here's how agencies track real client profitability — hours × rate vs invoice — and stop subsidising their worst clients without knowing it.

Contents
One flat fee for the whole team
Tasks, timers, CRM and invoices in one workspace. From $29 a month, no seat tax.
Start free demo14 days · no credit card
01. Why Revenue Is the Wrong Metric for Client Health
Ask any agency owner which client is their most valuable and they'll tell you — almost always — the one paying the highest monthly invoice. It's the intuitive answer. Revenue is visible. It lands in your account. It's the number that makes the month feel good. But revenue tells you what a client pays. It tells you nothing about what that client costs — in hours, in revisions, in communication overhead, in the emotional bandwidth of the people doing the work. Two clients paying $5,000/month can represent wildly different business outcomes depending on what those $5,000 actually required. The metric that matters is margin per client — revenue divided by total hours invested, at your actual hourly cost. Every other metric is a proxy. This is the real number, and most agencies don't track it.
"We had a client paying us $6,000/month for three years. When we finally tracked the hours properly, we found we were billing about $28/hour effective. We'd been our own cheapest contractor."
— Agency founder, 9-person digital studio
02. The Anatomy of a Profitable Client
A profitable client isn't just one who pays a high invoice. The combination of factors that determines real profitability:
- Clear briefs that minimise revision rounds
- Fast feedback and approval cycles
- Low communication overhead — focused messages, not constant availability demands
- Scope that stays within the agreed boundaries
- Invoice amounts that reflect the actual complexity of the work
03. The Four Hidden Costs That Eat Your Margin
Revision overhead: A project with three revision rounds typically consumes 40-60% more time than the original estimate. If revisions aren't scoped and tracked at task level, they're invisible in your billing. Communication tax: Some clients generate a call or long message thread for every deliverable. The communication-heavy client can add 20-30% to actual project hours without it appearing anywhere in your task list. Context-switching cost: Clients whose work requires constant context-switching cost more in productivity than their hours suggest. Scope creep absorption: The out-of-scope request that 'seemed small' and got absorbed rather than invoiced. Tracked across six months, these absorbed requests often total 15-25% of the billed work.

04. How to Calculate Your Real Hourly Rate Per Client
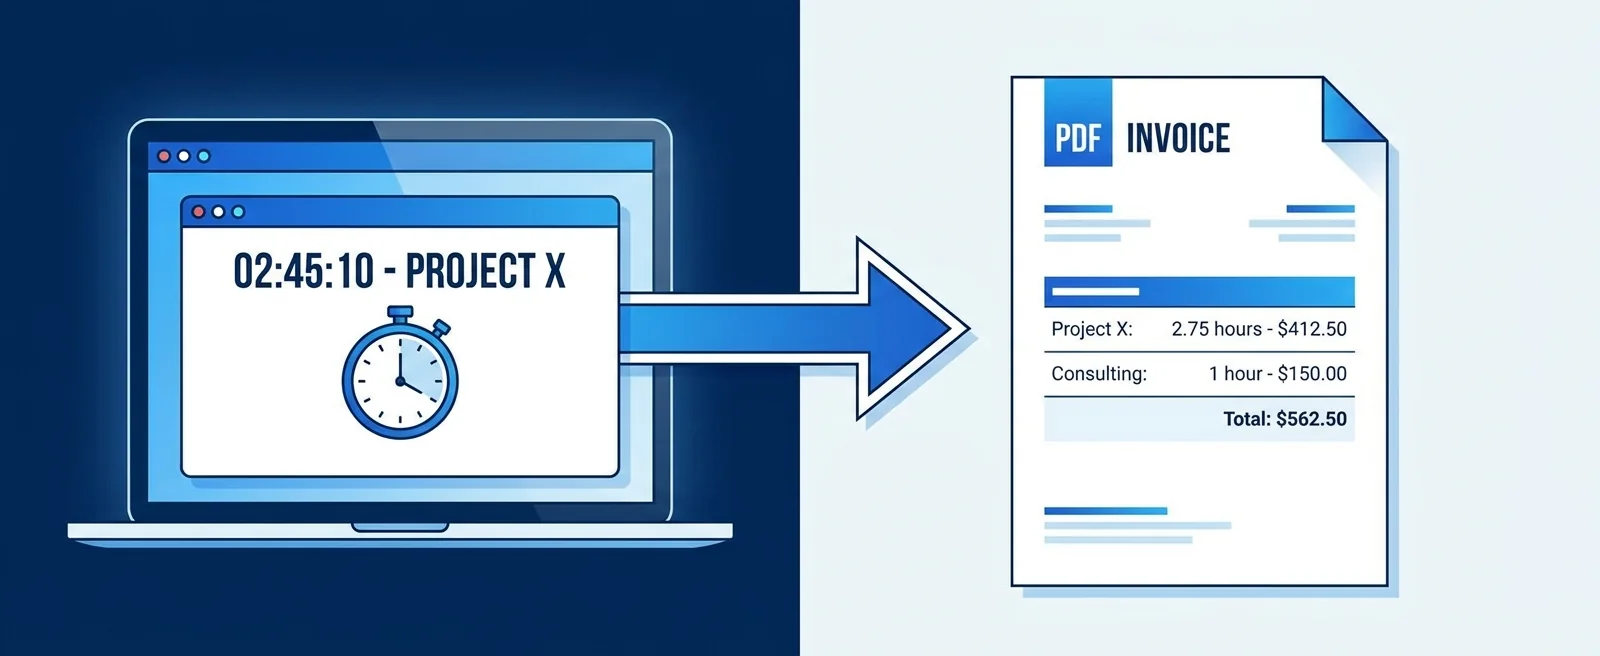
The calculation is straightforward once you have the right data. Total revenue from client (invoiced, not estimated) divided by total hours worked for that client (tracked, not estimated) equals your effective hourly rate. The challenge is the data. Most agencies have revenue in an invoicing tool, hours in a time tracker or not tracked at all, and no mechanism to connect the two at the client level without a manual spreadsheet exercise. The agencies that run this calculation consistently do so because their time tracking and invoicing live in the same system.
Melororium
Client Profitability — Automatic
Melororium Work Reports — see real hours per client and project against invoiced amounts, effective hourly rate calculated automatically.
Flat fee · no seat tax
See real profitability per client — no spreadsheet required.
Every hour tracked, every invoice compared, effective hourly rate calculated automatically in Melororium Work Reports.
Starter: $29/mo (4 users)
Agency: $59/mo (15 users)
Studio: $119/mo (Unlimited users)
05. What the Numbers Usually Reveal
Agencies that run this analysis for the first time consistently report the same pattern: the Pareto distribution applies to client profitability even more sharply than to client revenue. The top 20-30% of clients by profitability generate 70-80% of actual margin. The bottom 20-30% frequently operate at or near break-even — sometimes below it when all costs are counted. The clients in that bottom tier are often the ones who've been around longest. Long-term relationships that started at an early price point that was never revised. Relationships where 'being accommodating' has accumulated into a significant subsidy paid by the agency.
06. The Client Conversation That Follows the Data
Once the numbers are visible, the question is what to do with them. Most of the time there are three paths: raise the rate to reflect actual cost, reduce the scope to match what the current rate can support, or — in cases where neither is viable — exit the relationship. The data makes all three conversations easier, not harder. 'Based on the hours we've tracked on your account over the last three months, we've been delivering approximately X hours of work for Y invoice — which puts our effective rate at Z. To continue this work sustainably we need to adjust either the fee or the scope.' That's a professional, data-backed conversation.
07. Building a Profitability Tracking Habit
This analysis only has value if it's done regularly — monthly is ideal, quarterly at minimum. A one-time exercise tells you what's wrong today. A recurring review tells you which clients are trending better or worse over time, which is where the real strategic value lives. The agencies that make this habitual do it because the data is already there — timers running inside tasks, reports generating automatically. The agencies that do it annually do it because they have to reconstruct the data each time from multiple sources.
08. The Fix: One Dashboard, All Your Clients
The infrastructure requirement is simple: time tracked at task level, tasks connected to clients, invoicing data in the same system. When those three things are in one place, the profitability report is a view, not a project.
Boards that run themselves
Kanban with subtasks, priorities and a timer on every card
Demo request from Bloom Cosmetics
Website redesign · due Oct 14