What is a KPI?
KPI
A KPI is a specific, measurable number a team tracks to know whether it's hitting an important goal, not staying busy.
KPI stands for Key Performance Indicator. It's a measurable value that shows whether a team or organization is achieving its most important objectives. The word "key" is doing a lot of work: a KPI isn't just any metric, it's the metric that matters most for a specific goal.
A 10-person agency might track dozens of numbers: hours logged, emails sent, files delivered, Slack messages exchanged. Most of those are activity metrics: they measure busyness. KPIs measure outcomes: client retention rate, project margin, revenue per team member, on-time delivery rate.
The difference between a metric and a KPI: every KPI is a metric, but not every metric is a KPI. KPIs are chosen deliberately because they connect directly to business success.
Types of KPIs for Project Teams
KPIs fall into several categories depending on what they measure:
- Financial KPIs: revenue, profit margin, cost per project, average invoice value, revenue per team member
- Delivery KPIs: on-time delivery rate, sprint velocity, tasks completed per week, cycle time
- Quality KPIs: client satisfaction score (NPS), revision rounds per project, bug rate, rework percentage
- Team KPIs: billable hours ratio, utilization rate, employee satisfaction, overtime hours
- Client KPIs: client retention rate, client lifetime value, referral rate, response time
KPIs vs OKRs: What's the Difference?
KPIs and OKRs (Objectives and Key Results) are often confused. They're related but different.
KPIs are ongoing health metrics: they tell you if the business is performing normally. Revenue per client, utilization rate, on-time delivery. You track them constantly and react when they drift outside acceptable ranges.
OKRs are goal-setting tools: they define an ambitious objective and 3–5 measurable results that would prove you achieved it. OKRs are time-bound (usually quarterly), directional, and often a stretch from current performance.
Think of it this way: KPIs are the dashboard on your car (speed, fuel, temperature). OKRs are the destination you've set in the GPS. Both are necessary; they serve different purposes.
What Makes a Good KPI?
A good KPI passes the SMART test and three additional checks:
SMART: Specific (not "improve client satisfaction" but "maintain NPS ≥ 50"), Measurable (can you actually track it?), Achievable (realistic given your resources), Relevant (connected to a real business goal), Time-bound (reviewed weekly/monthly/quarterly).
Additionally: actionable (someone on the team can influence it), leading or lagging (leading indicators predict future performance; lagging indicators measure past results), and limited in number (3–7 KPIs per team, not 30).
Most teams track too many KPIs. When everything is important, nothing is. Pick the 3–5 numbers that, if they improve, you're confident the business is heading in the right direction.
| Bad KPI | Problem | Better KPI |
|---|---|---|
| Work harder | Not measurable | Billable hours ≥ 80% of capacity |
| Improve client satisfaction | Too vague | NPS score ≥ 50 this quarter |
| Do more projects | No target | Complete 12 projects in Q3 |
| Grow revenue | No baseline or target | Revenue per team member ≥ $8K/month |
Tracking KPIs: Dashboards and Reporting
KPIs only work if someone looks at them regularly. The most common failure mode: teams set KPIs in January, build a spreadsheet, and forget about it by March.
A KPI dashboard should update automatically or at least weekly, be visible to the whole team (not buried in someone's spreadsheet), and trigger a conversation when a number drifts. The dashboard is not the goal: the conversation it enables is the goal.
For project teams, the most useful KPIs to dashboard are: billable hours this week vs target, on-time delivery rate this month, revenue vs forecast, and team utilization rate.
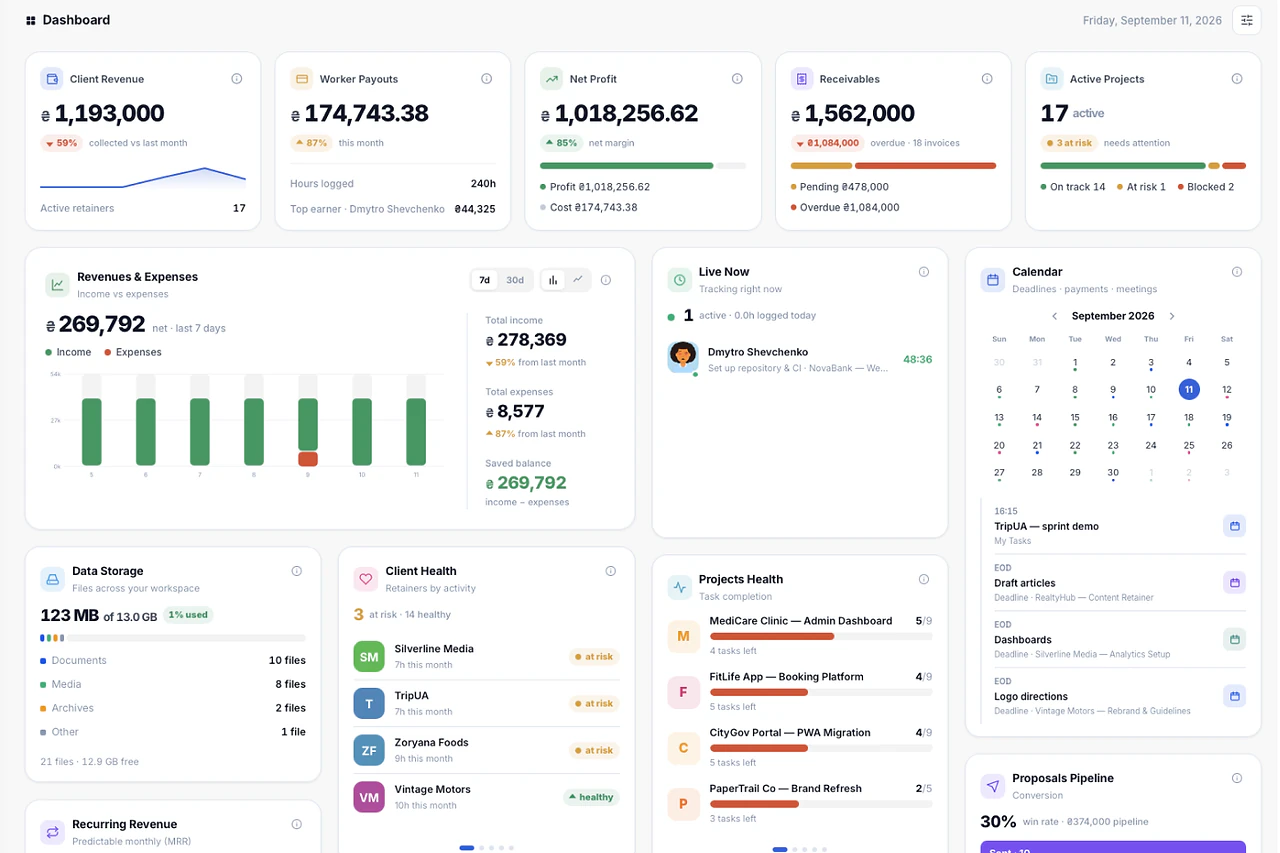
KPI Dashboard for a 10-Person Agency: What to Show
A KPI dashboard for a 10-person agency has one function: give the leadership team a clear read on the business in under 5 minutes. If reading the dashboard takes longer than 5 minutes, it holds too much information.
Revenue metrics belong at the top. Monthly revenue shows actual versus target, color-coded: green at 95%+ of target, yellow at 80–94%, red below 80%. Revenue by client shows which 3–5 clients generate the most revenue this month. If one client generates more than 40% of monthly revenue, flag it as a concentration risk. Outstanding invoices shows the total value of unpaid invoices past their due date, separate from current invoices. Month-over-month growth rate shows percentage change from the previous month, tracked as a 6-month trend rather than a single data point.
Project health metrics sit in the middle section. On-time delivery rate shows the percentage of projects or milestones delivered on or before the agreed date. A healthy agency runs above 80%. Average revision rounds per project surfaces briefing or quality review problems when it exceeds 3. Active project count compared to team capacity flags when the team is taking on more than it can absorb.
Team metrics complete the picture. Utilization rate (billable hours as a percentage of total available hours) runs healthy between 65–75% for most agencies. Below 60% means excess capacity. Above 80% means burnout risk. Remaining capacity by team member shows booked versus available hours for the current week so account leads know where new work can go.
Client metrics belong in a sidebar or secondary view: an NPS or satisfaction score tracked monthly or post-project, and client retention rate over a rolling 6-month window.
Three things that don't belong on the main dashboard: individual team member performance metrics, website traffic, and social media follower counts. These belong in separate views for the people who need them.
- Revenue: monthly vs. target (color-coded), client concentration risk, outstanding invoices, 6-month MoM growth trend
- Project health: on-time delivery rate (target 80%+), revision rounds (flag at >3), active project count vs. capacity
- Team: utilization rate (target 65–75%), remaining capacity per person this week
- Client: satisfaction score trend, retention rate over rolling 6 months
- Leave off the main view: individual performance metrics, website traffic, social follower counts
Setting KPIs for the First Time: Step-by-Step
Teams setting KPIs for the first time make two predictable mistakes: they set too many metrics, or they pick the wrong ones. Too many KPIs create reporting overhead without clarity. The wrong KPIs create the appearance of measurement without tracking what actually matters.
This process takes 3–4 hours for a leadership team and produces 5–8 KPIs worth tracking.
Step 1: Define outcomes, not activities (45 minutes). Before picking any metric, agree on 2–3 things the business needs to improve in the next 12 months. Write them as specific outcomes with numbers and deadlines. "Increase monthly revenue from $38,000 to $52,000 by December" is an outcome. "Grow the business" is not. Each KPI you set must connect directly to one of these outcomes.
Step 2: Find 2–3 metrics per outcome (60 minutes). For each outcome, identify the metrics that indicate whether you're on track. Include at least one leading indicator (activity that predicts future results) and one lagging indicator (results that already happened). For a revenue growth outcome: monthly revenue is lagging, proposal conversion rate is leading. Both belong in the set.
Step 3: Set baselines before setting targets (30 minutes). For each KPI: what is the current value? If you don't know, measure for 30 days first. A target without a baseline is a guess. Once you have a baseline, set a realistic target and assign a clear owner.
Step 4: Run each KPI through a three-question test (30 minutes). Can you measure it consistently and accurately? Can the team take action based on this number? Will this number change based on what the team does, or is it mostly driven by external factors? If any answer is no, replace the metric.
Step 5: Set the review cadence before publishing the dashboard (30 minutes). Decide who reviews each KPI and how often. Monthly works for most business KPIs. Weekly works for utilization rate and active project count. Quarterly works for retention rates. Publish the dashboard after two months of data: one month is too little context to act on.
| KPI | Baseline | Target | Review Cadence |
|---|---|---|---|
| Monthly Revenue | $38,000 | $52,000 | Monthly |
| On-Time Delivery Rate | 64% | 80%+ | Monthly |
| Utilization Rate | 71% | 68–75% range | Weekly |
| Proposal Conversion Rate | 31% | 45% | Monthly |
| Client Retention (rolling 6mo) | 72% | 85% | Quarterly |
KPIs That Look Good But Aren't
Vanity metrics are numbers that go up without indicating business health. Teams track them because they're measurable, trend positive in reports, and satisfy the need to show progress without requiring difficult decisions.
The cost: teams that optimize for vanity metrics improve the numbers without improving the business.
Website traffic without conversion data. A 40% increase in monthly visitors looks like progress. It's not progress unless those visitors take a meaningful action: demo request, contact form, purchase. Traffic without conversion data tells you nothing about business health. A site with 5,000 monthly visitors at a 3% conversion rate outperforms a site with 20,000 visitors at 0.4%. Replace with: conversion rate (target actions / visitors × 100).
Total projects completed. Finishing 23 projects this quarter instead of 18 looks like growth. It might mean the team is taking on smaller, less profitable work. Project count without average project value and margin is meaningless. Replace with: revenue per project and gross margin per project.
Social media followers. 10,000 LinkedIn followers impresses candidates. They don't pay salaries. Follower count has no direct relationship to revenue unless the team can show a conversion path from follower to paying client. Replace with: leads generated from social channels and social-to-client conversion rate.
Hours logged. More hours logged looks like a productive team. It might indicate overwork, poor estimation, or scope creep absorbing unbillable time. Hours logged is an input metric. Inputs don't indicate results. Replace with: utilization rate (billable hours as a percentage of total available hours) and project profitability.
Proposal count. Sending 12 proposals this month instead of 8 looks like sales activity. If 10 don't convert, the team spent significant time without generating revenue. Proposal count rewards activity, not outcomes. Replace with: proposal conversion rate and revenue value of won proposals.
Employee satisfaction survey score. A 7.8 out of 10 looks positive. Satisfaction scores are point-in-time, question-framing-dependent, and unstable week to week. Replace with: annual employee retention rate and voluntary turnover rate.
To find your own vanity metrics, apply one test per metric: "If this number increases, are we confident the business is healthier?" If the answer requires conditions, the metric is either a vanity metric or the wrong measure for what you're actually tracking.
- Website traffic → replace with conversion rate (target actions / visitors × 100)
- Projects completed → replace with revenue per project and gross margin per project
- Social followers → replace with leads generated from social and social-to-client conversion rate
- Hours logged → replace with utilization rate and project profitability
- Proposal count → replace with conversion rate and revenue value of won proposals
- Satisfaction scores → replace with annual retention rate and voluntary turnover rate
Reviewing KPIs: How to Run a Monthly Business Review
The monthly business review is where leadership looks at KPI data and makes decisions. Most teams run it badly. They present numbers, discuss why the numbers look a certain way, run out of time, and schedule a follow-up. No decisions get made. The next month starts the same way.
A well-run monthly business review takes 90 minutes and produces 3–5 decisions or action items.
Pre-meeting preparation belongs to whoever manages the KPI dashboard. Send the KPI report 48 hours before the meeting. The report shows: current value, target, last month's value, and a 3-month trend. Each KPI gets a status: on track (green), at risk (yellow), or off track (red). Attendees review the report before arriving. The meeting is not for presenting numbers. It's for deciding what to do about them.
Minutes 0–10: wins from last month. Name specific results. "Client X approved the brand without a revision round" or "We hit 82% on-time delivery for the first time." This isn't cheerleading. It anchors the meeting in what actually worked so the team can repeat it.
Minutes 10–40: red and yellow KPIs only. For each off-track or at-risk metric: what drove this result (name a process or condition, not a person), what has the team already tried, and what are the options for next month. Make a decision: what action, who owns it, what does success look like. No more than 15 minutes per KPI. If a problem needs deeper analysis, schedule a separate session.
Minutes 40–60: green KPIs. Are targets still right? Is there an opportunity to raise a target based on current performance? Are there early signals in a green metric that suggest a coming problem?
Minutes 60–80: next month's top 3 priorities. For each: what does success look like, who leads it, what resources does it need.
Minutes 80–90: action item readback. Read every action item from the meeting aloud: owner, description, due date. Every attendee confirms their items before leaving.
Run this meeting monthly for 3 months and track the close rate on action items. If fewer than 60% of items close by the next meeting, the items are too vague or the owners don't have the resources to complete them.
- Send the KPI report 48 hours before the meeting: attendees arrive having read it
- 0–10 min: specific wins from last month (names, numbers)
- 10–40 min: red and yellow KPIs only, one decision per metric, max 15 min each
- 40–60 min: green KPIs and target review
- 60–80 min: top 3 next-month priorities with owners and success criteria
- 80–90 min: action item readback with owner and due date confirmed aloud
- Track close rate: under 60% means items are too vague or owners lack resources
In Melororium
See Melororium's KPI dashboard
Common mistakes with kpi
What teams get wrong most often, and what to do instead.
- 1
Tracking activity instead of outcomes
Reporting hours logged or emails sent as if they were KPIs. Those measure effort, not whether the business moved forward.
- 2
Too many KPIs at once
Tracking fifteen numbers on a dashboard nobody checks. A handful of KPIs reviewed weekly beats twenty that get ignored.
- 3
No owner per KPI
Setting a target with nobody responsible for moving it. A KPI without an owner is a number on a slide.
- 4
Never revisiting the targets
Setting a KPI once and never checking whether it's still the right one as the business changes. Last year's target can quietly become irrelevant.
Frequently asked questions
How many KPIs should a team track?
3–7 is the practical limit. More than that and the team loses focus. Pick the metrics that most directly reflect whether your team is healthy and your clients are happy, then ignore the rest.
What's the difference between a KPI and a metric?
A metric is any number you can measure. A KPI is a metric that's been deliberately chosen because it directly signals whether you're achieving a key business goal. All KPIs are metrics; not all metrics are KPIs.
What are good KPIs for a 10-person agency?
On-time delivery rate (target ≥ 90%), billable hours ratio (target ≥ 75%), client NPS (target ≥ 40), project margin (target ≥ 30%), and team utilization rate. These five give you a complete picture of delivery, profitability, and team health.
Does Melororium have a KPI dashboard?
Yes. Melororium's Dashboard module shows team output, hours logged, project progress, and revenue metrics. Work Reports add a deeper view of hours per person per project, which feeds directly into utilization and billable rate calculations.