What is Throughput?
Throughput
Throughput is the number of tasks a team completes in a fixed period, a measure of output volume rather than how long any single task takes.
Throughput is the number of tasks a team finishes in a given period, typically a week. If a 10-person team closed 28 tasks last week, its throughput was 28 tasks/week. Unlike lead time or cycle time, throughput doesn't measure how long any individual task took. It measures volume: how much the team got done.
Throughput, lead time, and cycle time are the three metrics most Kanban teams track, and they answer three different questions. Lead time and cycle time both measure duration, how long a single task takes, from different starting points. Throughput measures count, how many tasks cleared the board in a period. A team can have a fast cycle time and a low throughput at the same time, if each task moves quickly but the team is only running a few tasks at once. For the duration metrics, see the Lead Time and Cycle Time entries; this entry covers the volume side.
Throughput matters most for forecasting. If a backlog holds 40 tasks and the team's throughput is 20 tasks/week, that backlog clears in roughly two weeks, assuming throughput holds steady. That kind of estimate doesn't require knowing how long any single task takes, only how many the team reliably finishes.
The Throughput Formula
Throughput equals the number of tasks completed divided by the length of the period measured. A team that closes 24 tasks in a 5-day week has a throughput of 24 tasks/week, or roughly 4.8 tasks/day. The period should stay consistent, weekly is the most common choice, so numbers are comparable from one period to the next.
Throughput vs Lead Time vs Cycle Time
All three are flow metrics, but they measure different things and answer different questions.
| Metric | Unit | What it measures | Question it answers |
|---|---|---|---|
| Throughput | Tasks per period | Volume of completed work | How much did the team finish? |
| Cycle time | Days per task | Active work duration | How long does one task take once started? |
| Lead time | Days per task | Total duration including wait time | How long does a client wait, start to finish? |
Throughput vs Velocity: Two Different Counting Systems
Velocity, the metric Scrum teams track per sprint, counts story points, not tasks. A team might report a velocity of 32 points in a 2-week sprint. Throughput counts finished items directly, with no estimation step in between.
The practical difference: velocity requires the team to first estimate every task in points, then track how many points close each sprint. Throughput counts what closed, regardless of size. Teams that don't estimate in points, most Kanban and continuous-flow teams, use throughput instead of velocity for the same forecasting purpose.
What Drives Throughput Up or Down
Several factors move throughput independent of how hard anyone is working.
- Team size and availability, fewer people or more time off lowers throughput directly
- Task size mix, a week full of small tasks produces a higher count than a week full of large ones, even with the same total hours worked
- WIP limits, too much work in progress at once slows every task down and can lower throughput despite everyone being busy
- Blocked work, tasks waiting on external input don't close, and they crowd out room for tasks that could close
- Context switching, a person splitting time across 4 tasks finishes fewer of them per week than someone focused on 2
A Worked Example: Reading a 4-Week Throughput Trend
A 10-person agency team tracked weekly completed tasks over a month.
| Week | Tasks completed | Note |
|---|---|---|
| Week 1 | 31 | Baseline |
| Week 2 | 29 | One designer on planned leave |
| Week 3 | 33 | Normal staffing, smaller task mix that week |
| Week 4 | 19 | Two large branding projects entered review and stalled |
Using Throughput to Forecast Delivery
Once a team has a stable throughput figure, that number turns a backlog into a rough delivery estimate without estimating every task individually. A backlog of 50 tasks against a throughput of 25 tasks/week suggests roughly two weeks to clear it, assuming no major change in team size or task mix.
This only holds if the historical throughput period is representative. A team's throughput measured during a slow month understates what it can do in a normal one, and a figure measured during a light-task-mix week overstates it. Most teams use a trailing 4 to 6-week average rather than a single week's number, which smooths out both effects.
Throughput in Melororium
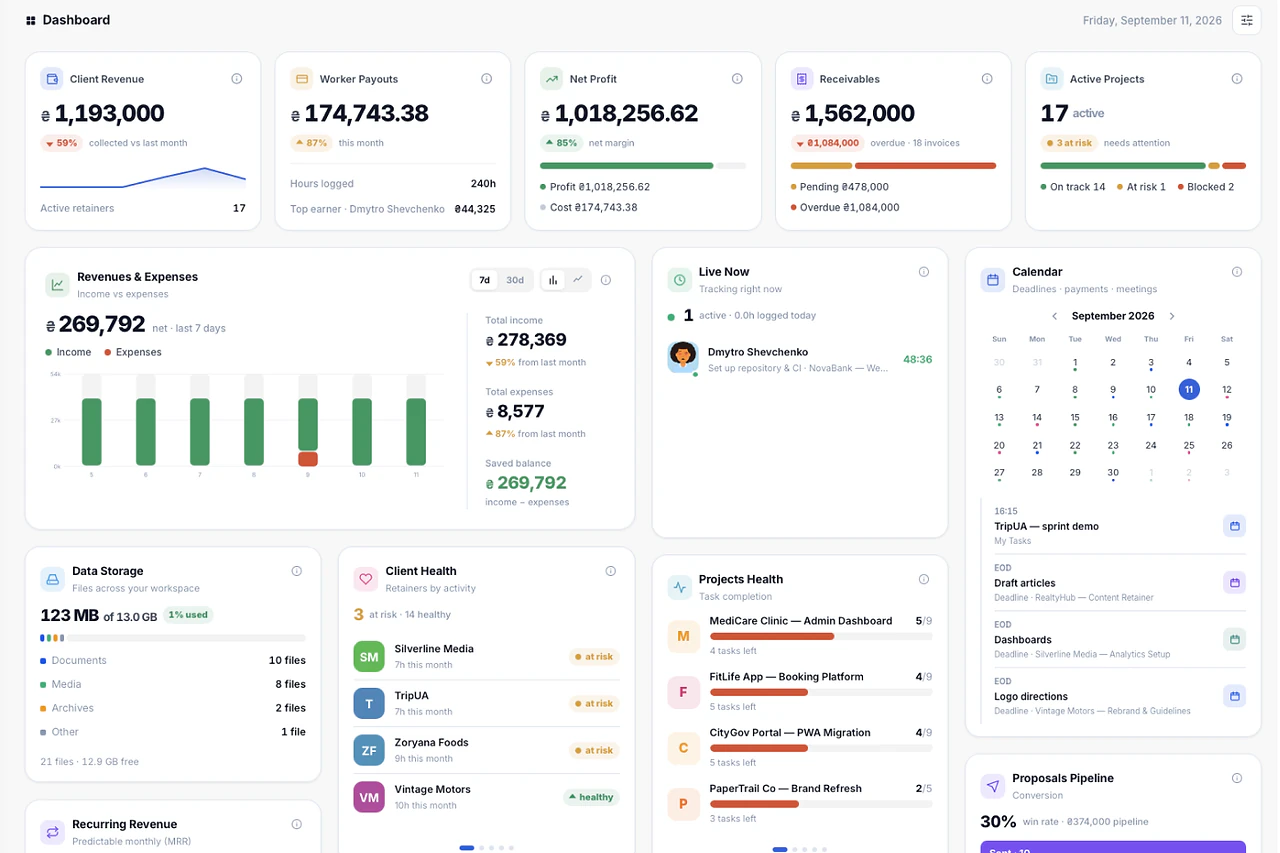
Project History timestamps every task closed, which makes throughput, completed tasks per week, calculable directly from the record without a manual count. Combined with Work Reports, teams can break throughput down by project or by person, and Project Alerts flags when a project's task-closing pace slows well below its own recent average, before a client notices the delay.
In Melororium
Track throughput from completed task history in Melororium
Common mistakes with throughput
What teams get wrong most often, and what to do instead.
- 1
Comparing throughput across teams of different sizes
Treating a 5-person team's 15 tasks/week and a 10-person team's 28 tasks/week as directly comparable. Without normalizing by headcount, the comparison says nothing about which team is more effective.
- 2
Using throughput as an individual scorecard
Ranking team members by tasks closed per week without accounting for task size. A person who closes 3 large strategy tasks a week isn't underperforming a person who closes 9 small copy edits.
- 3
Ignoring task-size mix when reading a trend
Reading a drop from 30 to 19 tasks/week as a productivity problem without checking whether the task mix shifted toward larger work. The same total hours produce very different counts depending on what's in the queue.
- 4
Inflating throughput by splitting tasks artificially
Breaking one real task into five trivial ones just to raise the weekly count. The number goes up; the actual output delivered to clients doesn't.
Frequently asked questions
What's a good throughput for a 10-person team?
It depends heavily on task size and industry, so there's no universal number. For agency-style task work, a mix of small revisions and multi-day deliverables, 25-40 tasks/week is a common baseline, but the number that matters is your own team's stable trailing average, not a benchmark from a different kind of team.
Does throughput measure quality of work?
No. Throughput counts what closed in a period, not how good it was. A team can raise throughput while quality drops if tasks are rushed or reopened later as revisions. Pairing throughput with a rework or revision-rate metric catches that gap.
How is throughput different from velocity?
Velocity counts story points closed per sprint and requires the team to estimate every task in points first. Throughput counts finished tasks directly, with no estimation step, which is why continuous-flow and Kanban teams generally use throughput instead of velocity.
Why did our throughput drop even though nobody left the team?
Usually a task-mix or WIP change, not a staffing change. A week with a few large tasks in review produces a lower count than a week with many small tasks finishing on schedule, even at identical total effort.
Does Melororium calculate throughput automatically?
Project History timestamps every task closed, which makes throughput, completed tasks per period, calculable directly from the record, broken down by project or by person through Work Reports.